The ROI of Real-Time Freight Visibility: What the Data Actually Shows
Supply chain visibility has been a buzzword for years. But the financial case for investing in real-time freight tracking has never been stronger — and the data from companies that have made the investment is now clear enough to quantify.
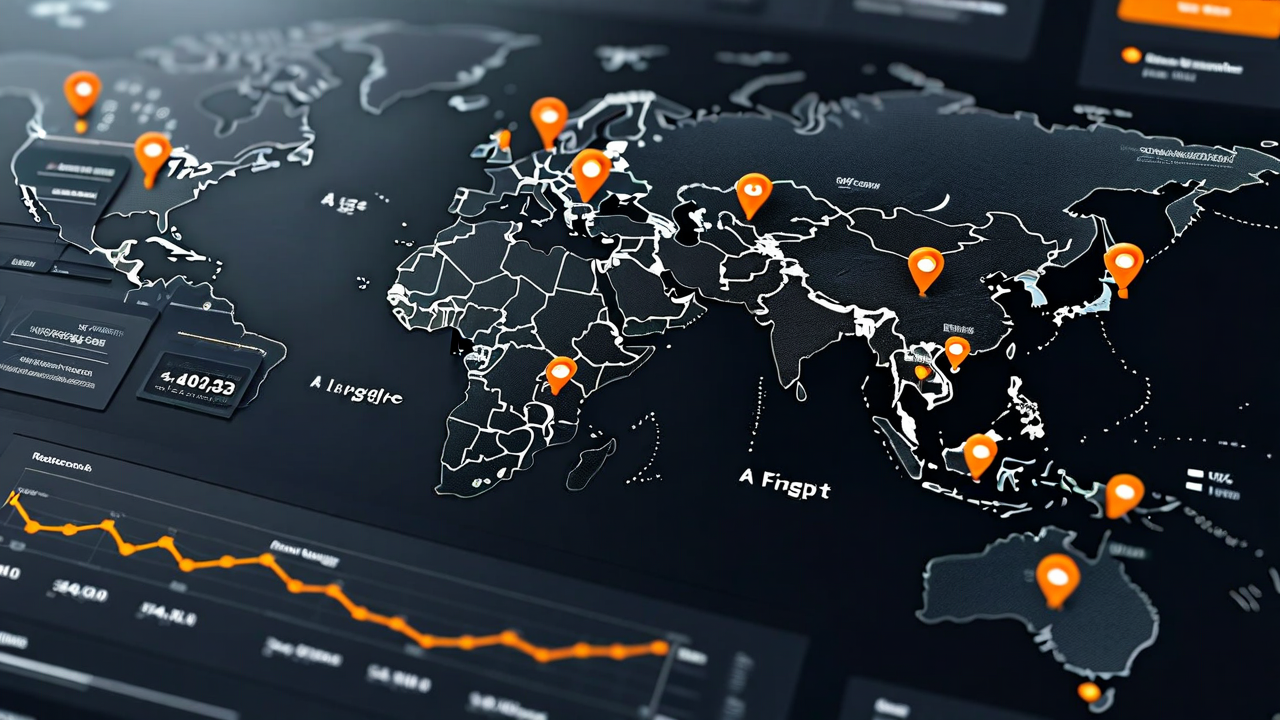
When logistics leaders discuss freight visibility, conversations often stay at the conceptual level: knowing where your shipments are is better than not knowing. That is obviously true, but it undersells the real business case. Real-time freight visibility is not primarily about peace of mind. It is about reducing the cost of uncertainty — and the cost of uncertainty in logistics is enormous.
This article examines the specific ROI drivers of real-time visibility investments, drawing on supply chain research, industry data, and the operational outcomes we observe in our customer base at RouteBrain. The conclusion is straightforward: for companies managing meaningful freight volumes, visibility technology generates returns that significantly outpace its cost.
The Cost of Not Knowing: Quantifying Visibility Gaps
Before making the case for visibility investment, it helps to quantify what visibility gaps actually cost. These costs show up in several places that are often tracked separately but are causally linked to the same root problem: not knowing where goods are or when they will arrive.
Exception management is the most direct cost. When a shipment is late or a carrier goes silent, someone has to find out what is happening. In most logistics organizations, this means phone calls to carriers, emails to freight forwarders, and manual shipment status requests. Industry estimates suggest that exception management consumes 20-30% of logistics team bandwidth in organizations without mature visibility systems. For a mid-sized company with a five-person logistics team, that is one to one-and-a-half full-time equivalents dedicated to reactive problem-chasing rather than strategic work.
Inventory buffer cost is the second major category. Companies that cannot reliably predict when inbound freight will arrive carry more safety stock to absorb transit variability. A study by Gartner found that poor supply chain visibility is directly correlated with higher inventory carrying costs, with companies in the bottom quartile for visibility carrying 30-40% more safety stock than their top-quartile peers. At typical carrying cost rates of 20-25% of inventory value, the financial exposure is substantial.
Customer SLA penalties represent a third category that is highly variable by industry but can be very large. Retailers that miss replenishment windows face stockouts and lost sales. Manufacturers that miss production schedule inputs face line stoppages. Logistics service providers that fail to deliver against contracted SLAs face penalty clauses and contract termination risk. All of these outcomes are more likely — and more expensive — when freight location and ETA data is unreliable.
The Three Stages of Visibility Maturity
Visibility is not binary. Companies go through a maturity curve, and the ROI profile changes significantly at each stage.
At Stage 1 — milestone tracking — logistics teams receive status updates at key events: shipment tendered, picked up, in transit, delivered. This is better than nothing, but it does not tell you when you will receive a shipment; it tells you when events already happened. The ROI at this stage is primarily in reducing the number of carrier calls required for basic status information.
At Stage 2 — GPS and real-time position tracking — teams can see where a shipment is at any given moment and get continuous ETA updates based on current position and historical lane performance. This enables proactive exception management — identifying delays before they cause downstream disruptions — and supports more accurate production scheduling and receiving planning. ROI at this stage is substantially higher, primarily through reduced exception management labor, better inventory positioning, and fewer SLA breaches.
At Stage 3 — predictive visibility — the system does not just tell you where a shipment is; it tells you where it is going to be and flags shipments at risk before the risk materializes. This requires AI modeling of lane-level performance variability, carrier reliability patterns, and external disruption signals. The ROI at this stage includes the earlier benefits plus the value of proactive intervention — rerouting at-risk shipments before they are late, adjusting production schedules ahead of time, and communicating accurate ETAs to downstream stakeholders.
The RouteBrain platform operates at Stage 3, combining real-time position data with predictive delay modeling to give logistics teams an accurate picture of not just where their freight is, but how it will perform against schedule.
Quantifying the ROI: By Category
Let us work through the ROI math for a mid-sized shipper managing 500 truckload equivalents per month across domestic and international lanes.
Exception management reduction: Assume 15% of shipments generate an exception that requires manual investigation, and each investigation takes 45 minutes of labor at a fully loaded cost of $35/hour. At 500 shipments per month, that is 75 exceptions, 56 labor hours, and approximately $1,960 per month in direct exception management cost. Real-time visibility with predictive alerting typically reduces exception investigation time by 60-70% because teams know about issues earlier and can resolve them before they escalate. Conservative estimate: $1,200/month in labor savings.
Inventory carrying cost reduction: If the company maintains $10M in inventory with a 25% annual carrying cost, improving ETA accuracy sufficiently to reduce safety stock by 5% saves $125,000 annually, or approximately $10,400 per month. This is a relatively conservative assumption — companies with mature visibility programs frequently report safety stock reductions of 10-15%.
SLA penalty avoidance: This varies widely, but for a company with $5M in annual freight spend and an average SLA penalty exposure of 2% of freight value for late deliveries, a 30% reduction in late deliveries driven by proactive rerouting saves approximately $30,000 annually, or $2,500 per month.
Total estimated monthly ROI for this example: approximately $14,100, or $169,200 annually. A visibility platform subscription for a company this size typically costs $24,000-$48,000 annually. The payback period is well under a year in most scenarios.
Beyond the Numbers: Strategic Visibility Benefits
The financial ROI calculation above is conservative in an important way: it captures only the operational savings, not the strategic value of visibility. Companies with strong freight visibility are better positioned to negotiate carrier contracts because they have accurate lane-level performance data to leverage. They can identify underperforming carriers systematically rather than relying on anecdotal complaints. They can make evidence-based decisions about carrier diversification and lane assignment.
Visibility data also enables supply chain continuous improvement in ways that are hard to quantify but clearly valuable. When you know which lanes consistently underperform, you can address the root causes — carrier capability gaps, origin facility delays, customs processing variability — rather than simply absorbing variability as a fact of life. Over time, this systematic improvement creates a compounding cost reduction that does not show up in the first-year ROI calculation but is very real in years two and three.
Implementation Considerations That Affect ROI
Not all visibility investments deliver their theoretical ROI. Several implementation factors are highly predictive of whether a visibility program succeeds or falls short.
Carrier coverage is the first critical factor. A visibility platform that only covers 70% of your carrier base leaves 30% of your freight in the dark — precisely the portion most likely to cause problems, since it tends to be lower-tier carriers that lack robust tracking capabilities. The best platforms supplement direct carrier integrations with third-party tracking data sources to achieve near-universal coverage.
Integration depth is the second factor. Visibility data generates value only when it flows into the workflows where decisions are made. A visibility dashboard that sits outside your TMS, WMS, and ERP is better than nothing, but a fully integrated visibility layer that surfaces alerts and ETA updates within the tools your team already uses is far more operationally effective.
Alert quality matters more than alert volume. A visibility system that sends 200 alerts per day — most of them minor or irrelevant — trains logistics teams to ignore alerts, defeating the purpose. Effective visibility platforms use AI to prioritize alerts by business impact, ensuring that the signals that reach human decision-makers are the ones that actually require action.
Key Takeaways
- Freight visibility gaps generate costs in three main categories: exception management labor, inventory buffer carrying costs, and customer SLA penalties.
- Visibility maturity progresses from milestone tracking to real-time GPS tracking to predictive delay modeling, with ROI increasing significantly at each stage.
- For a mid-sized shipper, conservative ROI analysis typically yields 3-5x return on visibility platform investment within the first year.
- Strategic benefits — better carrier negotiation, systematic lane performance improvement — compound the ROI in years two and three beyond the initial operational savings.
- Carrier coverage breadth, integration depth, and alert quality are the three implementation factors most predictive of visibility program success.
Conclusion
The business case for real-time freight visibility is no longer speculative. The data is in, and the returns are consistent across company sizes, industries, and freight profiles. The question for most logistics leaders is no longer whether to invest in visibility, but how to invest effectively — choosing a platform with the carrier coverage, predictive capabilities, and integration flexibility to deliver the full range of available ROI.
RouteBrain's visibility layer is built into the same platform as our route optimization engine, giving customers a unified view of routing decisions and live freight performance. Explore the platform or request a demo to see what end-to-end supply chain intelligence looks like in practice.